Validation
Generated from docs/_static/data/snapshot.json, which scripts/build_snapshot.py builds from the pinned upstream files. Model mbb-v0.5.0, package 0.5.0.
2024-25 season
Games through 2025-04-07; 779,064 possessions; 3,896 players with their own rating; box prior trained on 2021, 2022, 2023, 2024.
| Gate | Value | Low | High | Result | Detail |
|---|---|---|---|---|---|
intercept |
103.9 | 95 | 112 | pass | points per 100 possessions |
home_court |
2.926 | 1 | 4 | pass | per side, points per 100 |
sigma2 |
13,315.0 | 11000 | 15000 | pass | residual variance, (pts/100)^2 |
spearman_vs_reference_rapm |
0.9628 | 0.9 | pass | 2817 players with >= 500 offensive possessions | |
spearman_team_net_vs_torvik |
0.9534 | 0.93 | pass | 321 of 361 teams matched by name | |
torvik_teams_matched |
321 | 250 | pass | count | |
prior_cv_error_ratio |
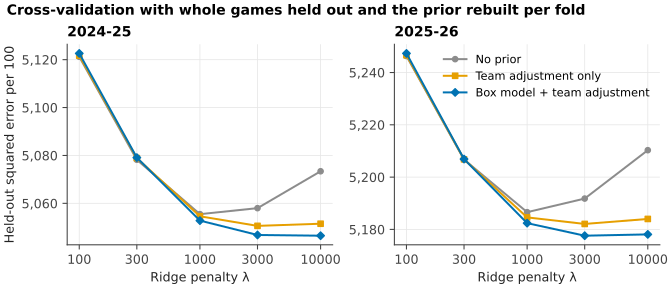
0.9983 | 1 | pass | held-out MSE 5,046.8 with prior (lambda 3000) vs 5,055.5 without (lambda 1000) | |
margin_sd |
11.15 | 10 | 12.5 | pass | points, D1 game margins |
team_war_vs_wins_correlation |
0.7928 | 0.7 | pass | 361 teams; wins = 14.1 + 0.76 x summed linear WAR | |
returning_player_prior_gain |
0.1222 | 0 | pass | 1840 players from 2024: correlation with 2025 no-prior ratings 0.508 with prior vs 0.386 without | |
revenue_win_effect_nonpositive_share |
0 | 0.1 | pass | of 400 school bootstrap draws | |
bid_calibration_max_decile_gap |
0.02446 | 0.05 | pass | 4545 team-seasons in 10 deciles, leave-one-season-out |
- Box model fitted on 2021, 2022, 2023, 2024 explains 31% of offensive and 13% of defensive no-prior ratings this season before the team adjustment (2847 players with >= 500 possessions). The adjustment is solved to match team ratings, so it is not scored here.
- Pythagorean exponent fitted on raw efficiencies: 7.79. Pomeroy's ratings page reports 10.25-11.5 for schedule-adjusted efficiencies; raw efficiencies give lower exponents because strong teams face strong schedules.
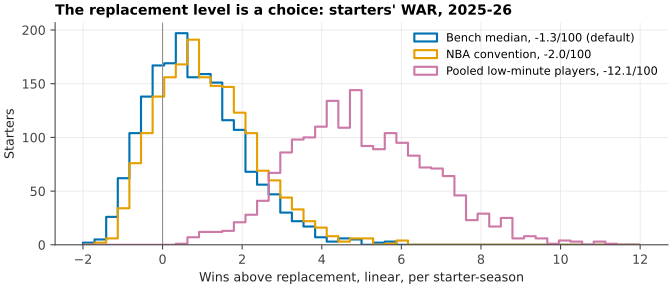
- Replacement level in use: bench median (-1.1 per 100). Alternatives: nba convention -2.0, pooled -9.3, bench median -1.1. WAR and every dollar figure scale with this choice.
- Game margin SD around fitted ratings: 11.2 points (D1 games only).
2025-26 season
Games through 2026-04-06; 840,040 possessions; 4,030 players with their own rating; box prior trained on 2022, 2023, 2024, 2025.
| Gate | Value | Low | High | Result | Detail |
|---|---|---|---|---|---|
intercept |
106 | 95 | 112 | pass | points per 100 possessions |
home_court |
2.611 | 1 | 4 | pass | per side, points per 100 |
sigma2 |
13,330.0 | 11000 | 15000 | pass | residual variance, (pts/100)^2 |
spearman_vs_reference_rapm |
0.9749 | 0.9 | pass | 3036 players with >= 500 offensive possessions | |
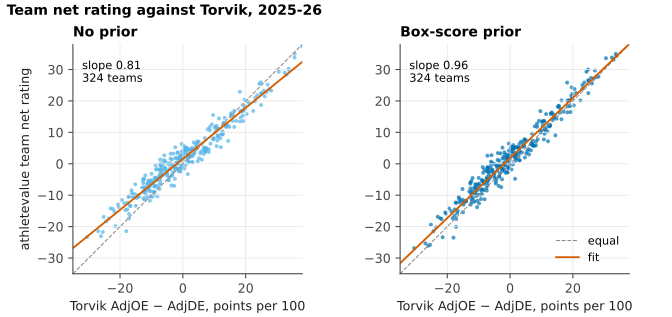
spearman_team_net_vs_torvik |
0.9708 | 0.93 | pass | 324 of 365 teams matched by name | |
torvik_teams_matched |
324 | 250 | pass | count | |
prior_cv_error_ratio |
0.9983 | 1 | pass | held-out MSE 5,177.6 with prior (lambda 3000) vs 5,186.6 without (lambda 1000) | |
margin_sd |
10.87 | 10 | 12.5 | pass | points, D1 game margins |
team_war_vs_wins_correlation |
0.8033 | 0.7 | pass | 365 teams; wins = 13.6 + 0.73 x summed linear WAR | |
returning_player_prior_gain |
0.124 | 0 | pass | 1735 players from 2025: correlation with 2026 no-prior ratings 0.524 with prior vs 0.400 without | |
revenue_win_effect_nonpositive_share |
0 | 0.1 | pass | of 400 school bootstrap draws | |
bid_calibration_max_decile_gap |
0.02367 | 0.05 | pass | 4910 team-seasons in 10 deciles, leave-one-season-out |
- Box model fitted on 2022, 2023, 2024, 2025 explains 33% of offensive and 13% of defensive no-prior ratings this season before the team adjustment (3060 players with >= 500 possessions). The adjustment is solved to match team ratings, so it is not scored here.
- Pythagorean exponent fitted on raw efficiencies: 7.60. Pomeroy's ratings page reports 10.25-11.5 for schedule-adjusted efficiencies; raw efficiencies give lower exponents because strong teams face strong schedules.
- Replacement level in use: bench median (-1.3 per 100). Alternatives: nba convention -2.0, pooled -12.1, bench median -1.3. WAR and every dollar figure scale with this choice.
- Game margin SD around fitted ratings: 10.9 points (D1 games only).
Returning players
1,735 players with at least 200 offensive possessions in 2025 and 500 in 2026, linked by person id. Correlation of the earlier rating with the later no-prior rating: 0.524 with the prior, 0.400 without.
Program economics
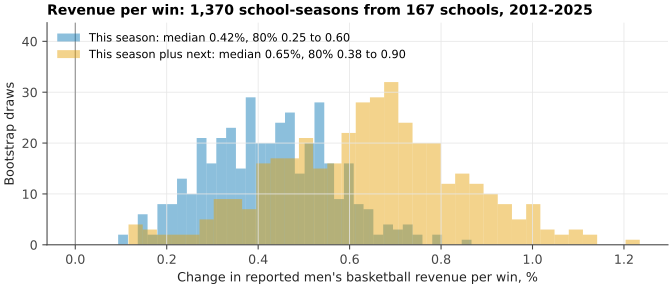
1,370 school-seasons from 167 schools, 2012-2025; 1.55 tournament units per bid.
| Effect on log revenue | Median | 80% interval |
|---|---|---|
| One win, this season | 0.0042 | 0.0025 to 0.0060 |
| One win, this and next season | 0.0065 | 0.0038 to 0.0090 |
| NCAA bid, this season | 0.0186 | -0.0050 to 0.0417 |
| NCAA bid, this and next season | 0.0494 | 0.0136 to 0.0830 |
- EADA has no per-sport archive for 2026; the revenue panel skips it
Interval coverage on synthetic data
Synthetic seasons and labels with known truth; no real player or program.
| Interval | Nominal | Mean coverage | Range | Runs |
|---|---|---|---|---|
| RAPM normal interval, no prior | 80% | 93.5% | 83.3% to 97.2% | 10 seasons |
| Market model CV+ | 80% | 90.6% | 86.0% to 93.5% | 20 fits |
Figures